
Introduction
The Environmental, Social and Governance (ESG) aspects of companies are becoming increasingly important for investors, regulators and stakeholders who want a better understanding of a company’s performance and risks beyond traditional financial metrics1.
ESG metrics and scores are also becoming an important asset for banking regulators and financial supervisors. For example, the EU legislative institutions have established stringent frameworks requiring financial institutions to report ESG risks and performance, with a strong emphasis on accountability and transparency.
In this changing landscape, CRIF has developed a comprehensive ESG framework, including data, analytics, professional services, platforms and consultancy, to support financial institutions in managing ESG risks and opportunities related to green finance.
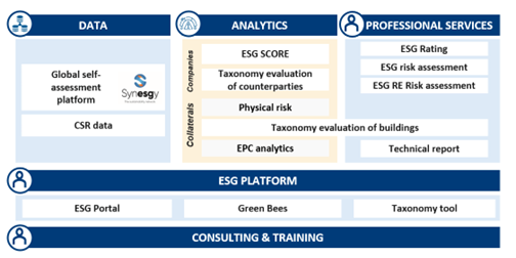
CRIF’s ESG framework is currently adopted by hundreds of European financial institutions to comply with the main regulatory and business requirements, such as:
- EU Taxonomy
- ESG Disclosures (Pillar 3, TCFD, NFRD, etc.)
- Integration of ESG risks within ESG policies and risk processes
- Operational risk management
CRIF ESG Score
The CRIF ESG Score is an innovative solution that assesses the ESG alignment of companies across Europe. It leverages both data collected directly from companies through its Synesgy platform as well as data collected automatically from several public sources and included in the CRIF ESG Data Lake, a comprehensive dataset that includes more than 140 ESG data points on companies, integrated and harmonized to provide comparable ESG assessments of companies at a pan-European level.
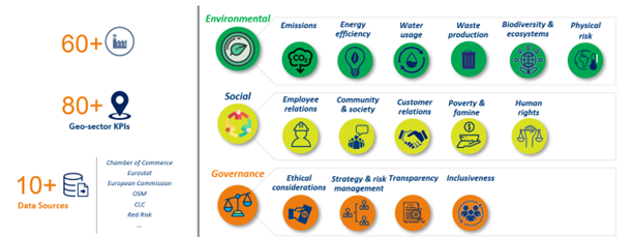
The datapoints are aggregated in 15 assessment areas, which determine the CRIF ESG Score. These areas contribute to the creation of the synthetic E, S, G and ESG scores, with an evaluation divided into 5 classes and supported by detailed reporting.
The ESG Score evaluates both the impacts that the company’s activities have on the environment and society but also the risks that sustainability issues pose to the company’s operations.
ESG analysis findings
This section presents the main findings from the ESG analysis of a representative sample of EU27 companies. The findings are broken down into some of the most significant components of the ESG score, highlighting the level of detail in the evaluation, which comprehensively covers the environmental, social and governance assessment of the companies.
ESG Score findings
The analysis aims to demonstrate how a standardized assessment facilitates cross-country comparisons across the EU27 countries. In order to do this, a sample of companies from the EU27 nations that are representative of the sizes and sectors of each country’s industrial profile were chosen. Subsequently, the ESG score and its components were then calculated for each company, with particular emphasis on the environmental risk. This factor can significantly impact both ecological sustainability and financial performance and because of that, the analysis includes detailed information on this risk. The resulting database was then used for a comparative analysis of the companies.
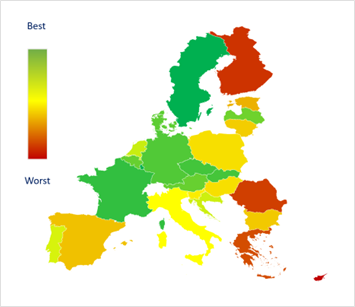
Figure 3 shows the average ESG Score of the companies being assessed, broken down by country. Overall, what emerges is a clear geographic trend: going from north to south and from west to east we see a decrease in Environmental Performance, which is reflected in the overall assessment. This is looked at in more detail in the next section.
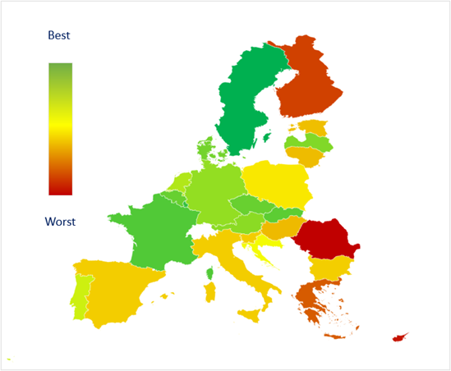
Table 1 highlights the specific differences in ESG assessments across various sectors. It presents the average ESG Scores at a NACE level, ranging from 1 to 5. A score of 1 indicates the best alignment with ESG principles, while a score of 5 indicates the poorest alignment. This assessment considers environmental aspects, such as environmental impact, physical risks and transition risks, as well as the social and governance practices implemented by individual companies.
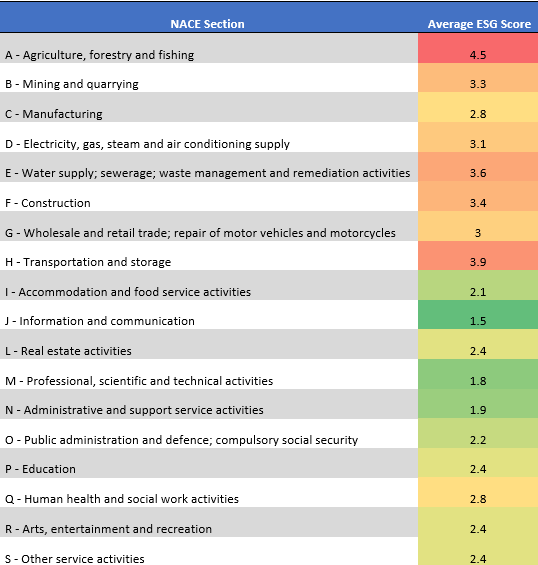
Looking at the sectors with very high risk, it is worth noting that the agriculture and transportation sectors have more companies that are not aligned with ESG themes. Environmental impact is a major factor in this assessment, as these sectors are characterized by significant greenhouse gas (GHG) emissions. They are also affected by transition risk, which can have a dual effect on these companies. First, there may be a reduction in demand and volumes due to increased consumer awareness of companies' environmental impacts. Second, there may be a reduction in margins for these companies as they are required to align with a low-carbon economy, requiring substantial investments to reduce emissions.
Focus on Environmental Score
As already mentioned, the environmental component represents a key aspect in assessing the compliance of companies with ESG principles (Figure 4). This because the main risks are strictly linked with the impact that the companies have on the environment.

Figure 5, showing the distribution of the E Score across Europe, shows the same geographic trend in two directions that can be seen for the ESG Score:
On one hand, looking north to south, the physical risk is particularly significant in southern European countries compared to those in the north, both in terms of acute risks (such as flooding) and chronic risks (such as sea level rises or chronic heat waves). These regional characteristics are further amplified by the earthquake risk.
On the other hand, when comparing countries from west to east, the environmental and social impact of companies differs structurally. In fact, countries that joined the European Union at a later stage have been slower to address environmental issues such as GHG emissions, waste management and energy efficiency.
Focus on Physical Risk
As previously mentioned, a significant portion of companies are significantly exposed to risks associated with both acute and chronic environmental conditions. Cyprus and Finland are especially affected by physical risks due to their geographical positions and features.
According to the analysis conducted by CRIF and RED2, most companies in Cyprus face very high physical risks due to the island’s location, with the primary risks being heat stress, heat waves and earthquakes.
In Northern Europe, Finland stands out for its high physical risk, in contrast to its neighboring countries. Many companies in Finland are exposed to significant risks, primarily due to the country’s susceptibility to cold waves and frost. These conditions can lead to business interruptions, logistical challenges in terms of goods and personnel, and increased heating costs. In addition, Finland’s unique terrain, characterized by land uplift, is particularly vulnerable to the effects of rising sea levels and increasing temperatures.
Focus on Emissions – GHG and Transition Risk
In the Emissions area, the assessment focuses on both GHG emissions and transition risk. This dual perspective provides a comprehensive assessment of a company’s environmental impact, considering both the quantity of emissions produced and the potential risks and opportunities associated with the transition to a low-carbon economy.
The production of GHG emissions is another key component in the understanding of a company’s alignment with the Environmental aspect. GHG emissions are classified into Scope 1, Scope 2 and Scope 3, where Scope 1 refers to direct emissions from sources owned or controlled by the organization, and Scope 2 covers indirect emissions from purchased electricity and energy consumption. Scope 3 includes all other indirect emissions associated with the organization’s activities, such as those from the supply chain, employee commuting and waste disposal. CRIF’s approach3 can estimate a company’s GHG emissions based on all its activities.
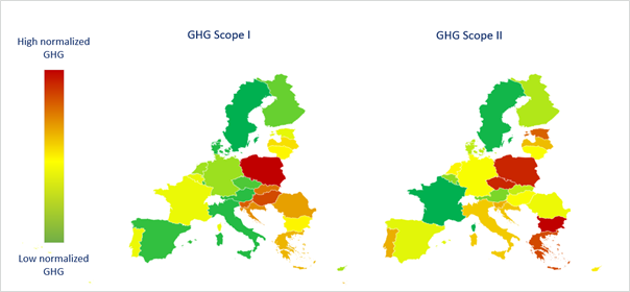
The analysis of emissions in Figure 8 represents the average normalized GHG emissions for all the companies in the sample, divided by country. The figure shows a heterogeneous distribution across Europe. Countries that make extensive use of renewable energy or produce energy through more sustainable methods rank among the lowest Scope 2 emitters. For example, France and Belgium have an energy mix characterized by a strong production of electricity from carbon free sources. At a sector level, as evidenced by a number of specialist research institutions4, agriculture is a high-emission sector. Other sectors at the top of the energy supply chain, such as mining and power generation, also produce significant emissions.
The production of GHG emissions is an important factor not only for assessing a company's environmental impact but also for understanding the transition risk it will face in the coming years. The transition to a low-carbon economy will penalize companies that produce high levels of GHG emissions. To assess this risk, CRIF evaluates companies through a transition risk score.
Transition risk specifically indicates the financial loss a company may incur, directly or indirectly, as a result of the adjustment process toward a low-carbon and more environmentally sustainable economy. CRIF has implemented a transition risk framework that allows the forward-looking impact of transition to a low-carbon economy over a 30-year period (until 2050) to be estimated at an individual counterparty level. This assessment considers various challenges that the transition will pose for companies, both in terms of revenues and the costs and investments necessary for the economic transition process.
In general, European countries have made significant progress in the transition process. As a result, half of companies in Europe have a low or moderate transition risk. But a not insignificant number of companies face high or very high transition risk. In Bulgaria, Poland and Cyprus, nearly one in two companies is exposed to high or very high risk. This is primarily due to the presence of high GHG-emitting industries, such as wholesale and retail trade, and agriculture, which will require a much more significant transition to a sustainable economy compared to lower-emission sectors.
Focus on Social and Governance Scores
In the context of ESG analysis, social and governance aspects are also evaluated, providing a comprehensive view of company performance. The focus includes crucial issues such as labor rights, diversity, inclusion and good governance practices, all of which play an important role in shaping a company’s sustainability and reputation.
For social aspects, the assessment specifically considers the company’s impact on the community where it operates, both in terms of relationships with its employees and its impact on the local area’s economic development. The variables considered to determine these factors are tailored to the specific characteristics of the sectors they represent. For example, the assessment of dimensions such as fatal and non-fatal workplace accidents reveals significant variations across sectors and countries: companies operating in sectors largely relying on manual labor, such as agriculture and construction, record a significantly higher number of incidents and score poorly in this area. As a result, these sectors are highly penalized in our evaluation. Similarly, there are also significant differences in terms of gender balance depending on the sector analyzed. Tertiary sectors tend to have a more balanced workforce composition; indeed, sectors such as healthcare, education and other services excel in this area and are, on average, among the top 20% of companies across Europe for employee gender balance.
As for employee relations, the governance dimension also shows significant differences in the gender gap between companies, often correlating with sectors traditionally dominated by male workers. This is notable in the mining and construction sectors, which have fewer female managers. These sectors show a lack of transparency and are more prone to corruption and money laundering, similar to trends seen in the real estate sector.
Conclusion
In conclusion, this analysis highlights significant differences at both country and sector levels in the main ESG components of European companies. For the Environmental aspect, countries vary not only due to their physical characteristics such as geographic location and morphology, but also because of differing energy policies and levels of industrial development. Countries with more advanced industries are exposed to lower risks both in terms of environmental impact and transition risks toward a low-carbon economy. However, individual companies can also pursue ESG roadmaps that go beyond GHG production. Social impact within the local community, responsible governance policies, and efforts to mitigate discrimination are factors that individual companies can actively pursue to enhance their ESG initiatives. Thus, while national policies and industrial landscapes play significant roles, proactive corporate ESG initiatives can drive meaningful change and foster long-term resilience.
1 More specifically, the Environmental component assesses how a company impacts - and is impacted by - the local and global environment and ecosystem; the Social component examines how a company interacts with its suppliers, customers and communities; while the Governance component evaluates how well a company leads, manages and interacts with its shareholders.
2 RED S.p.A. (www.redrisk.com) is a highly specialized consulting company in the assessment of natural, climate-related and man-made disasters.
3 The methodology has been developed in line with the Partnership for Carbon Accounting Financials guidelines, which give priority to official GHG emissions data or, when the latter is not available, recommend the use of quantitative estimates based on the company’s industry, size and in general its industrial organization.
4 EXIOBASE, a global, detailed Multi-Regional Environmentally Extended Supply-Use Table and Input-Output Table, which reports high CO2 production coefficients per euro of revenue for the agricultural sectors.